Database quantifies wasted natural gas from Eagle Ford Shale in South Texas
By John Tedesco, San Antonio Express-News
The energy boom that’s showering rural South Texas with money is also wasting an irreplaceable natural resource.
Drive through the bustling oil patch of the Eagle Ford Shale, located about an hour away from San Antonio, and you’ll quickly lose count of fiery gas flares that dot the countryside.
Natural gas is cheap. Pipelines are expensive. So instead of collecting the fossil fuel, many oil and gas operators build tall, metallic flare stacks to burn the gas and release it into the Texas sky.
For years, no one knew exactly how much gas was going to waste. While everyone knew flaring in shale country was a problem, officials at the Railroad Commission of Texas, the state agency that oversees the oil and gas industry, had never released figures showing how much was being burned in the Eagle Ford.
Instead, the agency released only statewide figures showing the overall volume of flaring was low compared to overall production — about one percent.
Whenever a government agency touts rosy statistics, there’s probably a database behind those numbers. And if you obtain that raw data, you might be able to figure out what’s really going on.
That’s what we set out to do in the spring of 2013.
Getting the data
We started out by filing an open records request for the huge database of monthly reports showing how much oil and gas is produced in Texas and where those hydrocarbons go. Flaring and venting were one of the “disposition” categories in the data.
We asked for text files of the production data for the entire state of Texas from the early days of the boom in 2009 to the present. That way we could compare rates of flaring in Eagle Ford counties to other parts of the state.
But the Railroad Commission said the database was stored in an old version of Oracle and it would cost more than $1,000 to convert a copy for us.
There was another option. The Railroad Commission also sold its entire production database dating to 1993 for $234. The hitch: The data had to be exported as Oracle .dmp files, and we’d have to find a way to make that format work.
About this article
This article first appeared in Uplink, IRE and NICAR’s online publication for data journalism.
Subscribe to Uplink and you’ll read about the latest software tools, tricks for solving data problems and first ventures by budding data journalists. To subscribe, visit your member profile and go to “Add Subscription.”
We didn’t use Oracle in the newsroom and had never heard of .dmp files. But Express-News Data Editor Joe Yerardi and I figured we could find a solution. I remember him saying something along the lines of, “Just get it and we’ll figure it out.”
Yerardi was right – we eventually figured it out. But it took a lot longer than we expected.
We bought the database and I drove to the agency’s Austin headquarters with a flash drive that could handle the enormous database. When I got back, Yerardi and I had a surprisingly difficult time finding someone with Oracle who could help us convert the .dmp files. Finally, through the miracle of Google, I stumbled across a company called Intelligent Converters that offered an array of software products that convert all kinds of file types. OraDump to CSV met our needs, so we bought the export kit for $149.
The software worked. But the oil and gas production files were so large it took months to convert them. Yerardi left his computer on all day and never logged off through the summer of 2013 as the conversion process dragged on and we worked on other stories.
By the time everything was finally converted to CSV files, Yerardi wisely left San Antonio and take a job at inewsource in San Diego. Before he left, he gave me the relevant CSV files we needed to crunch the flaring numbers using Navicat and MySQL database manager. Now we could finally analyze what we had.
Analyzing the data
It turned out it took more than simply summing flaring numbers by county in a GROUP BY query to figure out how much gas was being flared in the Eagle Ford Shale. It wasn’t that simple.
For example, production and flaring numbers for gas wells are reported for each individual well. But oil wells produce natural gas, too. Flaring figures for oil wells are reported differently. Instead of showing figures for each well, the database shows flaring for an entire oil lease. An oil lease can encompass vast Texas ranches with hundreds of oil wells that span more than one county.
In such cases, there are two monthly production reports for the lease – one for each county. The production numbers are accurately reported for each county in the lease in a “county” table.
But flaring numbers in a different table weren’t reported by county. They were reported for the entire lease in one record, not two. So my queries joining the “county” table and “disposition” table were double counting some records in the flaring field.
An example: At the Julie Beck oil lease operated by an energy company called Cinco Natural Resources, Cinco produced more than 120,000,000 cubic feet of gas in Karnes County, and 2,000,000 cubic feet in nearby Live Oak County in January 2012.
But in the query where I joined the county and disposition table together, the same flaring number showed up twice. It looked like this in my query results:
| COUNTY | PRODUCED GAS | FLARED OR VENTED GAS |
| Karnes | 122,200,000 | 104,044,000 |
| Live Oak | 2,023,000 | 104,044,000 |
So the total amount of flared gas was exceeding the amount of produced gas, which is obviously wrong. The same thing was happening in hundreds of oil leases that spanned more than one county.
The Railroad Commission has a blanket policy of barring any employees from talking to the media, which meant I couldn’t talk to the IT folks directly. So I had to identify these pitfalls in the data myself. I lived in a perpetual state of fear of getting something wrong. Which is a good thing. I was continually telling the Railroad Commission what I was looking at, what problems I was finding, and how I was resolving them. The agency rarely granted interviews. But spokeswoman Ramona Nye did respond to all questions by email. When things got technical, she served as the intermediary between me and the IT folks at the Railroad Commission. It was a tedious process but they did respond to every question and even emailed us the SQL language they use to fix the double-counting problem when I asked them about it.
The Railroad Commission’s website let us look up production and flaring numbers for individual sites, which helped factcheck our findings. Keeping a data log, suggested by Steve Doig at Arizona State University and Elizabeth Lucas from IRE and NICAR at the 2012 IRE Conference, was also very helpful when we had to retrace our steps months later and double-check the numbers.
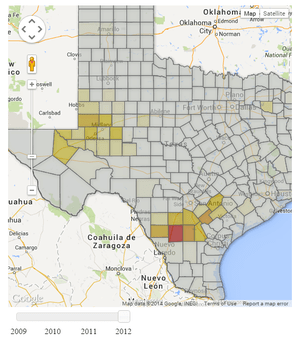
Our analysis showed that the volume of flared gas in Texas had increased by 400 percent since 2009. And most of that gas came from the Eagle Ford Shale near San Antonio. This chart essentially told the story of our four-part series about flaring. State regulators didn’t even know this.
Finishing the story
But the data was only one part of the story. We had to find people affected by the flaring and air pollution that comes from it. With photographer Kin Man Hui and energy-beat reporter Jennifer Hiller, I made a half-dozen trips to the shale play, interviewing people who lived near flares, taking pictures and shooting video. We heard a flare that roared like a rocket, and saw cows grazing in a field at night that was lit by a quiet, primordial flame burning on top of a nearby flare stack.
Reporting the story took so long, two different data editors named Joe helped with it. As we continued working on the story through the early part of 2014, our flaring numbers were getting stale. We had complete figures for the year 2012 but only partial figures for 2013. We wanted to update our numbers. But we couldn’t afford the delay in obtaining and converting a fresh batch of Oracle data. So Yerardi’s successor, Joseph Kokenge, helped us update a new batch of data for 2013 by scraping it directly from the Railroad Commission’s website.
Kokenge used the programming language Ruby and the associated Web-framework, Ruby on Rails, to organize the code and files that were generated.
Ruby has a number of helpful libraries for navigating and parsing HTML pages and web sites. Kokenge relied heavily on two libraries: Nokogiri and Watir. Nokogiri (Japanese for ‘saw’) slices up the HTML of a page based on the CSS used to style the page. Watir allows for automated manipulation of the buttons, text boxes, radio buttons and drop-down lists of a Web page. Watir fires up an actual browser, mimicking the way in which a human would navigate the page, which was helpful for the way in which the Railroad Commission had built its page.
Once Kokenge had downloaded all the lease pages for all the Eagle Ford counties, two more scripts (or in Ruby on Rails terminology ‘Rake tasks’) turned the resulting 4 gigabytes of HTML into two CSV files. One file held the monthly oil and gas production and disposition totals for each lease. And another file held the monthly, county-by-county production totals for each lease.
The results showed that in 2013, the volume of flared gas continued to increase in South Texas. Energy firms operating Eagle Ford wells lost more than 35 billion cubic feet of gas that year — a 65 percent increase from 2012, when flaring and venting totaled more than 21 billion cubic feet.
Quantifying the volume of flared gas opened up new questions and possibilities. When Projects Editor David Sheppard asked how much air pollution was created by all this flaring, we found out there was a way to calculate an estimate. We obtained emails from the state’s environmental agency, the Texas Commission on Environmental Quality, that showed how to estimate levels of air pollution created by gas flares. Those formulas were based on the volume of flared gas – which we had. So we plugged those numbers into Excel spreadsheets to come up with the amounts of sulfur, volatile organic compounds and other pollutants that came from flaring in the region.
We could also do the same thing to estimate the market value of the lost gas, based on economic figures we got from the U.S. Energy Information Administration.
This was a story where readers could easily get lost in the numbers. So we tried to put those numbers into context and help readers visualize what they mean. For example, we found that energy producers flared 39 billion cubic feet of gas from 2009 to 2012. Most people have no idea how much that is.
But if you tell them that’s enough to meet the annual needs of every San Antonio household that relies on natural gas, readers immediately understand that’s a lot of wasted hydrocarbons.
Joseph Kokenge contributed to this article.
John Tedesco works on the projects team at the San Antonio Express-News. He can be reached at jtedesco@express-news.net. Joseph Kokenge is data editor and can be reached at jkokenge@express-news.net.