
If you fill out the "Forgot Password" form but don't get an email to reset your password within 5-10 minutes, please email logistics@ire.org for assistance.
See this post and more like it at NICAR talk, our data blog: ire.org/nicar
Mike Soraghan is an oil and gas reporter at EnergyWire (an arm of E&E Publishing) and former NICAR bootcamper from 2013. For those of you who have been to bootcamp, you remember Open Lab, held (almost) every night after class wraps up for the day. Even back then, Mike was toiling over some nasty-looking data on oil spills.
Last month EnergyWire published Mike's story about smaller oil spills, the kind of spills that don't usually make it into the news but that collectively amount to quite an impressive number: "More than 26 million gallons of oil, hydraulic fracking fluid, 'fracking' wastewater and other substances," the report says.
Knowing that he pulled reports on spills from states individually, and having gotten a glimpse at what he was up against, I was curious how this came together.
Tip: Mike links to the data at the bottom of his story, as well as some documentation he wrote up.
How did he know the data was there?
Mike had been reporting on a story about oil and gas enforcement in 2011 when he came across some online state databases of oil spills. He also knew that most producing states require reports on spills over a set amount. So he set out to see just how much data he could get.
How did he put it all together?
Much of the data came in spreadsheet form, although some of it had to be copied and pasted from websites that didn't allow easy downloads. Where state data was unavailable, he went to federal sources to see what he could find: The U.S. Coast Guard's National Reponse Center and Bureau of Land Management (BLM).
"I marked the source of each data (state oil and gas agency, state environmental agency, federal agency), and whether it could be used for my basic tabulation of spills. I put BLM data in the database so I would have it. But there's no clear way to ensure that they're not duplicates of spills also reported to state agencies, so I left them out of my count."
He made necessary transformations to the data in Excel, and then used Access to put it all together in the right order. He flipped back and forth, making necessary adjustments until it could all work together. In the past he has scrapped an entire database after realizing he should have approached it differently. Unfortunately there's no manual for bringing data from various sources into one harmonious database.
Tip: To see the list of state agencies that collect these reports, see Mike's documentation.
What were the biggest challenges with the data?
The data kept by these agencies are not uniform. Fields differ from agency to agency, spill amounts were recorded in different units, gallons or barrels. Mike had to normalize a lot of this: convert gallons to barrels, find the necessary common fields in the different spreadsheets, and put them together.
"The data is horribly inconsistent. After all that cutting, pasting and appending, all I really had was one big number of spills (and year-over-year growth), and the volume. Even then, those are minimums. I know it's an undercount."
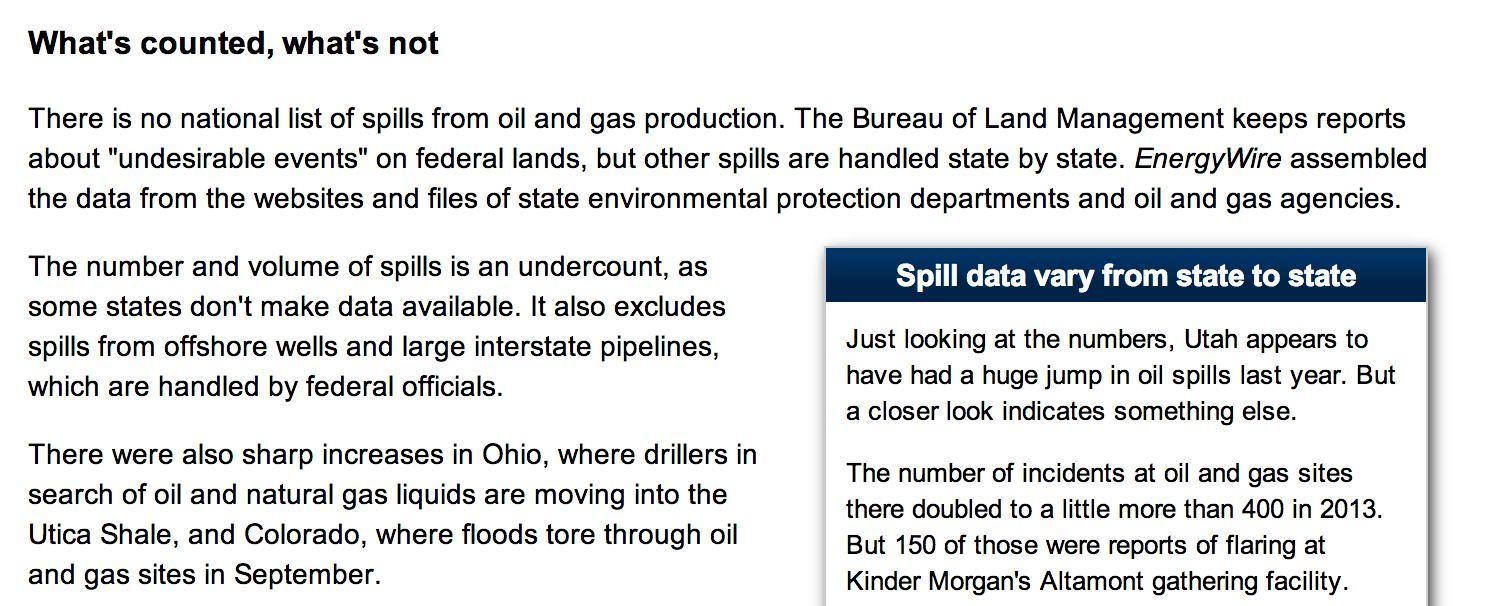
Mike wisely included a sidebar right next to the story titled "Spill data vary from state to state," an important measure of transparency that acknowledges some of the important shortcomings of the data.
Read Mike's story, which was the most-read story on the site for about a week.
To learn more about covering the oil and gas industry, check out our tipsheets at the IRE Resource Center.

Looks like you haven't made a choice yet.
