
If you fill out the "Forgot Password" form but don't get an email to reset your password within 5-10 minutes, please email logistics@ire.org for assistance.
 Police typically conduct sober checkpoints around the holidays, especially New Year’s Eve. Add context to your stories about holiday safety and travel by looking to look at trends in fatal crashes where drugs and alcohol were noted as a factor.
We’ll walk you through how to quickly gather statistics and come up with story ideas using our simplified DOT Fatality Analysis Reporting System database (FARS).
[This is the third and final installment of a blog post series on how to use FARS Simplified. Our first post included story ideas on pedestrian and shopper safety, as well as the worst holiday travel times. The second post explained how to look at dangerous winter weather conditions.]
In the example that follows, we’ll use data on the state of California to look at fatal crashes around New Year’s.
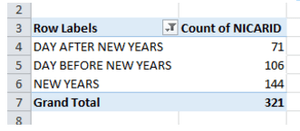
 1. Create a Pivot Table with “HOLIDAY” as the Row Labels and “COUNT of NICARID” as the Values. This will show you how many fatal crashes took place on each holiday. Filter to narrow your results down to just the holidays or holiday window you’re interested in. For this example, we just want to look at New Year’s. We can see there were 144 fatal crashes on New Year’s Day in California between 2003 and 2013.
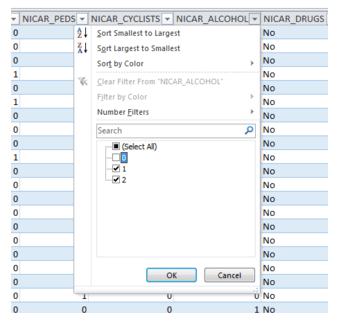
2. Now let’s see how many of those involved a driver that might have been under the influence of alcohol*. Double-click on the number 144 to generate a new spreadsheet showing just the New Year’s Day crashes. On this new spreadsheet, find the NICAR_ALCOHOL column and use the Filter to show anything greater than or equal to 1. This will narrow your results down to any time one or more drivers was possibly under the influence of alcohol. We can see that 69 of the 144 New Year’s Day crashes might have involved alcohol. You could run a similar analysis by making a Pivot Table with “NICAR_ALCOHOL” as the Row Labels, “COUNT of NICAR_ALCOHOL” as the Values.
You can also run a similar analysis using NICAR_DRUGS.
* An important note: The NICAR_ALCOHOL and NICAR_DRUGS fields are based on observations of police officers at the scene of the crash. It does not mean the drivers were considered legally drunk or reflect official testing. You’d need to do additional reporting to confirm specific cases
About the database:
Our full DOT Fatality Analysis Reporting System database (FARS) has 19 tables and almost 800 columns of detailed information about fatal car accidents. To save you time, we created a single-table database that gives you the essential information for every fatal crash. Use it to quickly report stories or add depth to deadline reporting. The data covers 2003-2013 (the most recent year available) and comes pre-loaded in Microsoft Excel. Purchase the simplified data set, and you’ll be able to download data for the entire country, just a state, or both.
You can purchase the data and view the documentation here. Please read the documentation before using the data: it contains important information about how to analyze and cite the data accurately.
If you have questions about the FARS database, please contact NICAR Data Library Director Liz Lucas at liz@ire.org.

Looks like you haven't made a choice yet.
