
If you fill out the "Forgot Password" form but don't get an email to reset your password within 5-10 minutes, please email logistics@ire.org for assistance.
More than 3,100 people across the country died in fatal car crashes in the three-day window around Christmas in the 11-year period from 2003 to 2013. More than 500 of those involved snow, rain, sleet or hail, according to accident records.
It’s easy to localize a story about dangerous winter driving conditions in your community. Our new, simplified DOT Fatality Analysis Reporting System database (FARS) allows you to quickly filter down fatal accidents to focus on a city or state, look at fatal crashes by holiday, and hone in on those that involved inclement weather.
[This is the second installment of a blog post series on how to use FARS Simplified. Our first post included story ideas on pedestrian and shopper safety, as well as the worst holiday travel times.]
FARS Simplified comes pre-loaded in Microsoft Excel. More information on the database is available below, but here are a few ways to analyze the data. In this example, we’re using data for the state of Illinois.
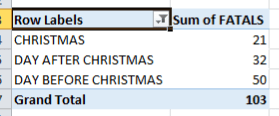
1. To look at the number of people killed around Christmas: Create a Pivot Table with “HOLIDAY” as the Row Labels, and “Sum of FATALS” as the Values. You can use the Filter to focus on a specific holiday or holiday-range. In the example on the right, we looked at the three days around Christmas in Illinois (years 2003-2013). Holiday-specific information is available for several key dates, including New Year’s.
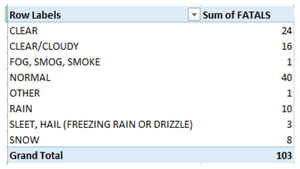 2. To look at the weather conditions for the Christmas crashes, create a second Pivot Table. (Double-clicking on the Grand Total in your previous Pivot Table will generate a new spreadsheet with just the results relevant to your search. You can use this to create a second Pivot Table.) This time, make “WEATHER” your Row Labels and “Count of WEATHER” your Values. In this Illinois example, we can see that snow was noted as a factor in Christmas crashes that resulted in 8 deaths.
Of course, there are all kinds of ways you could use this data to report on dangerous driving conditions. You might want to look at all of the crashes in a holiday season, say from Thanksgiving to New Year’s. NICAR_ACC_DATE can help with this.
About the database:
Our full DOT Fatality Analysis Reporting System database (FARS) has 19 tables and almost 800 columns of detailed information about fatal car accidents. To save you time, we created a single-table database that gives you the essential information for every fatal crash. Use it to quickly report stories or add depth to deadline reporting. The data covers 2003-2013 (the most recent year available) and comes pre-loaded in Microsoft Excel. Purchase the simplified data set, and you’ll be able to download data for the entire country, just a state, or both.
You can purchase the data and view the documentation here. Please read the documentation before using the data: it contains important information about how to analyze and cite the data accurately.
If you have questions about the FARS database, please contact NICAR Data Library Director Liz Lucas at liz@ire.org.

Looks like you haven't made a choice yet.
