
If you fill out the "Forgot Password" form but don't get an email to reset your password within 5-10 minutes, please email logistics@ire.org for assistance.
 We know how busy the end of the year can be, so we’ve put together a simplified database on fatal car accidents to help you produce year-end stories with impact.
Our full DOT Fatality Analysis Reporting System database (FARS) has 19 tables and almost 800 columns of detailed information about fatal car accidents. To save you time, we created this single-table database that gives you the essential information for every fatal crash. Use it to quickly report stories or add depth to deadline reporting. The data covers 2003-2013 (the most recent year available) and comes pre-loaded in Microsoft Excel. Purchase the simplified data set, and you’ll be able to download data for the entire country, just a state, or both.
To make things even easier, we’ve put together a couple of story guides to help you get an idea of how you might use this data to quickly add context to the holiday stories you’re probably already writing. This is our first story guide, and we’ll have two more coming before both Christmas and New Year's.
You can purchase the data and view the documentation here. Below you’ll find our story suggestions. Please read the documentation before using the data: it contains important information about how to analyze and cite the data accurately.
Story Idea #1: Shopping Safety
Black Friday is often one of the busiest shopping days of the year and a great time to think about driver and pedestrian safety around malls, shopping centers and busy downtown corridors.
You might want to start by looking at Black Friday (labeled "Day after Thanksgiving" in the HOLIDAY column) and Thanksgiving day, since many shoppers head out that evening.
Once you have your filtered list, get the latitude and longitude of each crash using “NICAR_LATMAP” and “NICAR_LONGMAP.” Import that data into a mapping program (here are some suggestions) and use the visualization to hone in on potential hotspots (shopping centers, malls, downtown areas).
Look to see how many people died in crashes in key areas using the “FATALS” field, which shows the total number of deaths. And don’t forget about the pedestrians who might be trying to cross a street or standing in line outside of a store. See if any of those killed were pedestrians using the “NICAR_PEDS” field.
Of course, you’ll have to do some reporting to find out if the fatal crashes had anything to do with Black Friday or holiday shopping. But the data should help you identify trends and potentially dangerous areas in your community.
Story Idea #2: Worst Travel Times
It’s a question that comes up every year around the holidays: Is it better to hit the road, say, the Wednesday before Thanksgiving or the morning of the holiday?
We can ask the data.
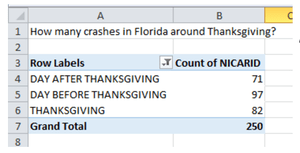
Look at the number of accidents per day around the holiday period and see which day is the worst. You can do this by creating a pivot table using the HOLIDAY field. NICAR created this field to save you the step of having to look up historical holiday dates. The HOLIDAY field includes:
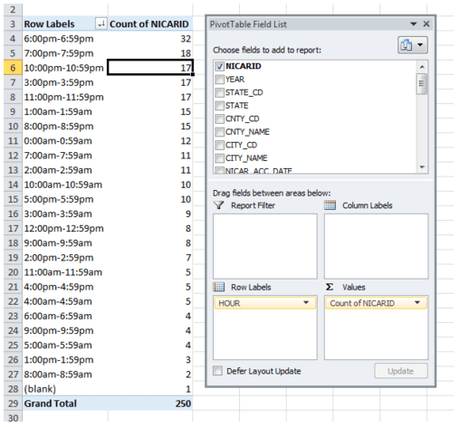
You can even look for the deadliest hour the night before Thanksgiving or the morning of the holiday using a pivot table:
Make HOUR the row label and do a count of NICARID. Filter on HOLIDAY to look only at a certain day, such as Thanksgiving, or a date range. Sort the records in the pivot table by 'count of NICARID,' descending, and you will see the hour when the most fatal accidents occurred.
An important note:
FARS records only include fatal accidents. If you want to broaden your story to include minor crashes, you can request records from your local police department. In some states, crash records are available on a highway patrol’s website. For example, the Missouri State Highway Patrol website generates downloadable records on Excel spreadsheets based on your selection of date, time, crash severity, crash type, county and city.
If you have questions about the FARS database, please contact NICAR Data Library Director Liz Lucas at liz@ire.org.

Looks like you haven't made a choice yet.
